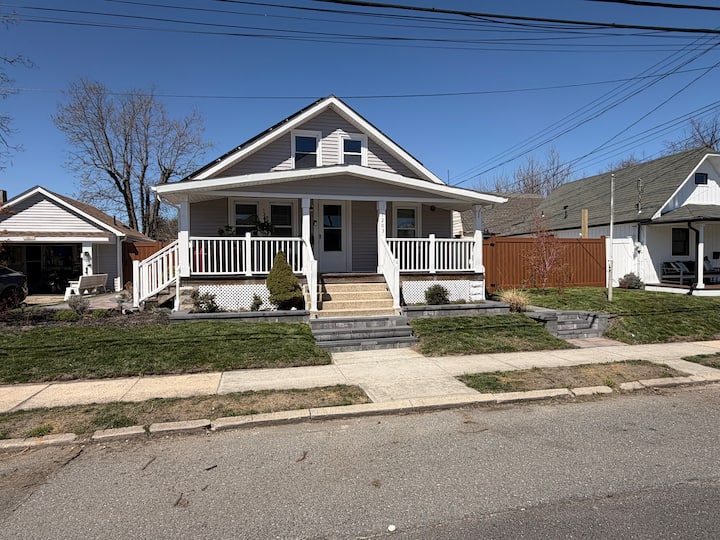
1203 Bayview AveFUTURE CLIENT
West Belmar Family Home · Belmar, NJ · New listing
2026 WITH EAM: LAUNCH SEASON
$25K to $40K
Aug to Dec partial year: launch, listing rebuild, review ramp. Peak tail plus fall weekends.
2027 SELF-MANAGED EXPECTATION
$45K to $55K
A brand new listing, 7 blocks back, at typical pricing. Honest starting point.
2027 WITH EAM
$70K to $85K
First full year target: where it lands depends on the upgrades we scope together
THE 2027 GAP
+$15K to $40K
Per year vs self-managing
Based on 10 comparable 4 BR rentals in the Belmar area; top performers reach $128K per year. Source: Dynamic pricing software + market data, July 2026.
A note on the ranges: they are heavily influenced by the level of investment in the property. Continuous improvement as we launch and operate, furnishings, amenities, photography, small upgrades, raises quality and ratings, which raises the nightly rate the home can command. We narrow the range together when we scope the plan.
Monthly revenue, first full year (2027): self-managed vs with EAM
Self-managed baseline (midpoint)
EAM target (midpoint)
| Month | Self-managed | With EAM | Nightly rate range | Avg occupancy |
|---|---|---|---|---|
| Jan | $848 | $1,888 | $86 to $177 | 16% |
| Feb | $613 | $1,464 | $71 to $174 | 21% |
| Mar | $3,026 | $3,365 | $185 to $211 | 75% |
| Apr | $3,488 | $3,849 | $233 to $259 | 82% |
| May | $2,552 | $4,218 | $375 to $510 | 43% |
| Jun | $7,850 | $8,963 | $498 to $620 | 68% |
| Jul | $8,108 | $16,534 | $740 to $844 | 83% |
| Aug | $10,811 | $17,217 | $799 to $862 | 86% |
| Sep | $4,783 | $6,122 | $439 to $562 | 55% |
| Oct | $3,823 | $5,390 | $244 to $291 | 74% |
| Nov | $3,039 | $4,743 | $254 to $338 | 58% |
| Dec | $1,061 | $3,747 | $293 to $319 | 26% |
| Full year | $50,000 | $77,500 |
The operator behind the numbers

Cody Zucker, CPA
Founder, Endless Asset Management
Text or call anytime: (848) 288-1129 · cody@endlessassetmanagement.com
Consistently outperforms the market
In the metrics that drive income: nightly rate, occupancy, and direct booking percentage.
500+ stays hosted at the Jersey Shore
Accommodated across all of our Shore properties.
Superhost for 25+ quarters straight
Airbnb's highest host standard, held without a break.
Top rated Airbnbs at the Jersey Shore
4.97 stars across 238 reviews, with 6 Guest Favorite listings.
What guests say about our Shore homes
★★★★★
“Perfect stay for the weekend with my family of 6! Enjoyed the location and the house itself was clean and new. Cody was very proactive and easy to contact.”
Jessica M · A Shore Thing · Airbnb · Jun 2026
★★★★★
“The cottage was exactly what the 2 of us were looking for. Location was very good located between down town and the beach. ... Host almost instantly got back to us when we had a question. ... So over all I highly recommend this cottage. We will be back.”
Paul B · The Beach Bum · Vrbo · Jun 2026
★★★★★
“Great location, walkable and very clean space for our family of four! Cody was a responsive host with lots of good suggestions. Would highly recommend this rental!”
Thu T · The Embury Hideaway · Airbnb · Jun 2026
P.S.
Jimmy, I really enjoyed getting to speak with you, learning more about your goals, and getting to see the property. I am really looking forward to potentially working together and to meeting in person on Monday to discuss your estimate, our agreement and the net take home numbers.
Cody
Next step: full revenue estimate walkthrough
Monday, July 13, after 1 PM, in person. We will spend a good amount of time reviewing the revenue models and pricing, as well as the management agreement, together. We are especially excited to bring your net take-home numbers to that conversation.
Cody Zucker, CPA · Text or call: (848) 288-1129 · cody@endlessassetmanagement.com